

August 2025 Denver Real Estate Trends
Numbers reflect data as of July 31, 2025
If the Colorado housing market were a music festival, August would be when the headliner’s set slows down: the lights are still on, the crowd’s still there, but the tempo’s dropped and the energy’s shifted.
Buyers aren’t rushing the stage, sellers aren’t throwing crowd-pleasing deals, and the beat is steady enough that you can actually hear yourself think. For some, that’s a relief. For others, it’s a little unnerving.
Inventory: Plenty to Browse, Fewer New Arrivals
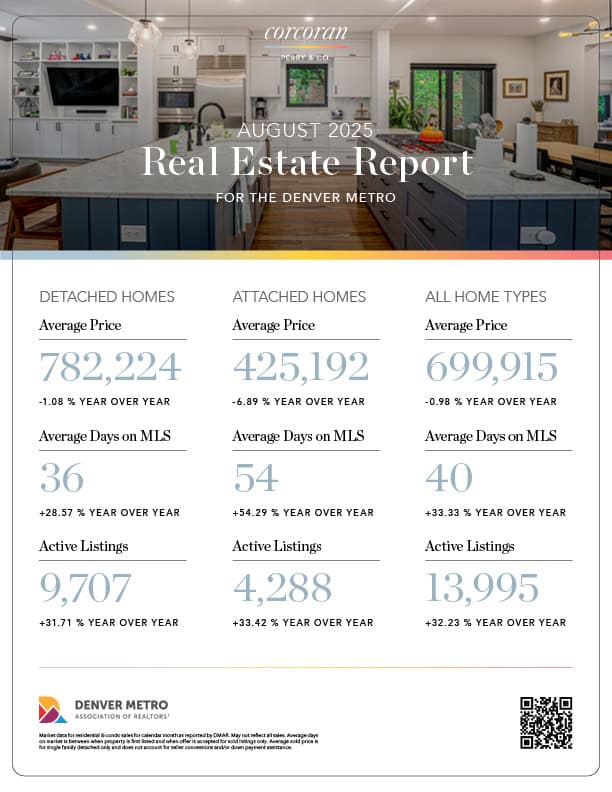
Active listings barely changed from June (-0.09% month-over-month) but are still 32.23% higher than last summer — proof that the extreme scarcity of recent years has eased.
But, new listings fell 9.61% month-over-month. That means new listings were coming, but not necessarily going. Some homeowners are simply not ready to give up their 3% mortgage rates. Others are waiting to see how the economy plays out before listing and/or buying. The result is a market where inventory isn’t flying off the shelves, and it’s not being restocked either.
Sales: Contracts Signed, Closings Lagging
Pending sales dipped slightly (-0.31% month-over-month, +6.61% year-over-year), but closed sales dropped (-11.31% month-over-month, -6.84% year-over-year).
This is the real tell: deals are being made, but not all are making it across the finish line. Tightened lending (thanks in part to an 8% student loan delinquency rate that resulted from the end of a pause on reporting student loan delinquencies) and buyers second-guessing are slowing the pace.
Prices: A Small Step Down
Average closed prices fell 5.62% month-over-month and 0.98% year-over-year. Median prices dropped 3.28% month-over-month and 1.67% year-over-year.
The month-over-month drop is to be expected, but the year-over-year shift is something to keep an eye on because it can’t be explained by seasonality. The driver of the decline isn’t a flood of distressed sales — it’s affordability caps. High interest rates mean buyers simply can’t stretch to last year’s price levels, especially with more listings giving them room to negotiate. Adding to the affordability challenge, tariffs on building materials are inflating new-build costs by $7,500–$10,000, pricing many out of new builds and increasing the days on the market stat.
This is the first year-over-year dip in prices we’ve seen in a while, and it may be the early signs of a shifting market.
Days on Market: The New Pulse of the Market
Average days on MLS rose 5.26% month-over-month (33.33% year-over-year), with median days spiking 33.33% month-over-month and 50% year-over-year.
Here’s the thing: closed sale prices tell you where the market’s been. Days on market tell you where it’s headed. In July, more homes sat longer, a signal that buyers are choosier and sellers need to nail their pricing from the jump. In other words, the clock is now as important as the price tag.
 Corcoran Perry & Co. Featured Listing: 4041 E Forbes Court, Greenwood Village
August Colorado Housing Market: Reading Between the Songs
July didn’t bring a heartbreaking ballad or a pulse-racing rager… it brought the pause between big tracks. Buyers are catching their breath, sellers are recalibrating, and the market’s tempo is steadily softening. That’s one trend we’ve seen progressing month after month, after month. No jarring turns or tumbles, just modestly shifting numbers telling the story of the adjusting real estate environment.
If you’re a seller, that means pricing with precision, not nostalgia. If you’re a buyer, it means watching the listings, knowing you have a bit more room to move, but still needing to act when the right home hits.
The homeownership music hasn’t stopped, but you can definitely hear the space between the beats.


Socials