

It’s tempting to say that the June 2026 Denver housing market report is ‘more of the same’.
Home values increased at the expected year-over-year rate, new listings stayed light, pending sales increased, while closed sales decreased… just like the Denver metro area has generally seen for a couple of years. The difference is: the typical activity bump (no matter how modest) we see nearly every spring is currently either late to the party or has already RSVPd regrets.
In May, there were fewer listings, fewer closings, and more days on market (as compared to last spring). In other words, spring fever didn’t register with buyers or sellers.
The June 2026 Denver Housing Market Numbers
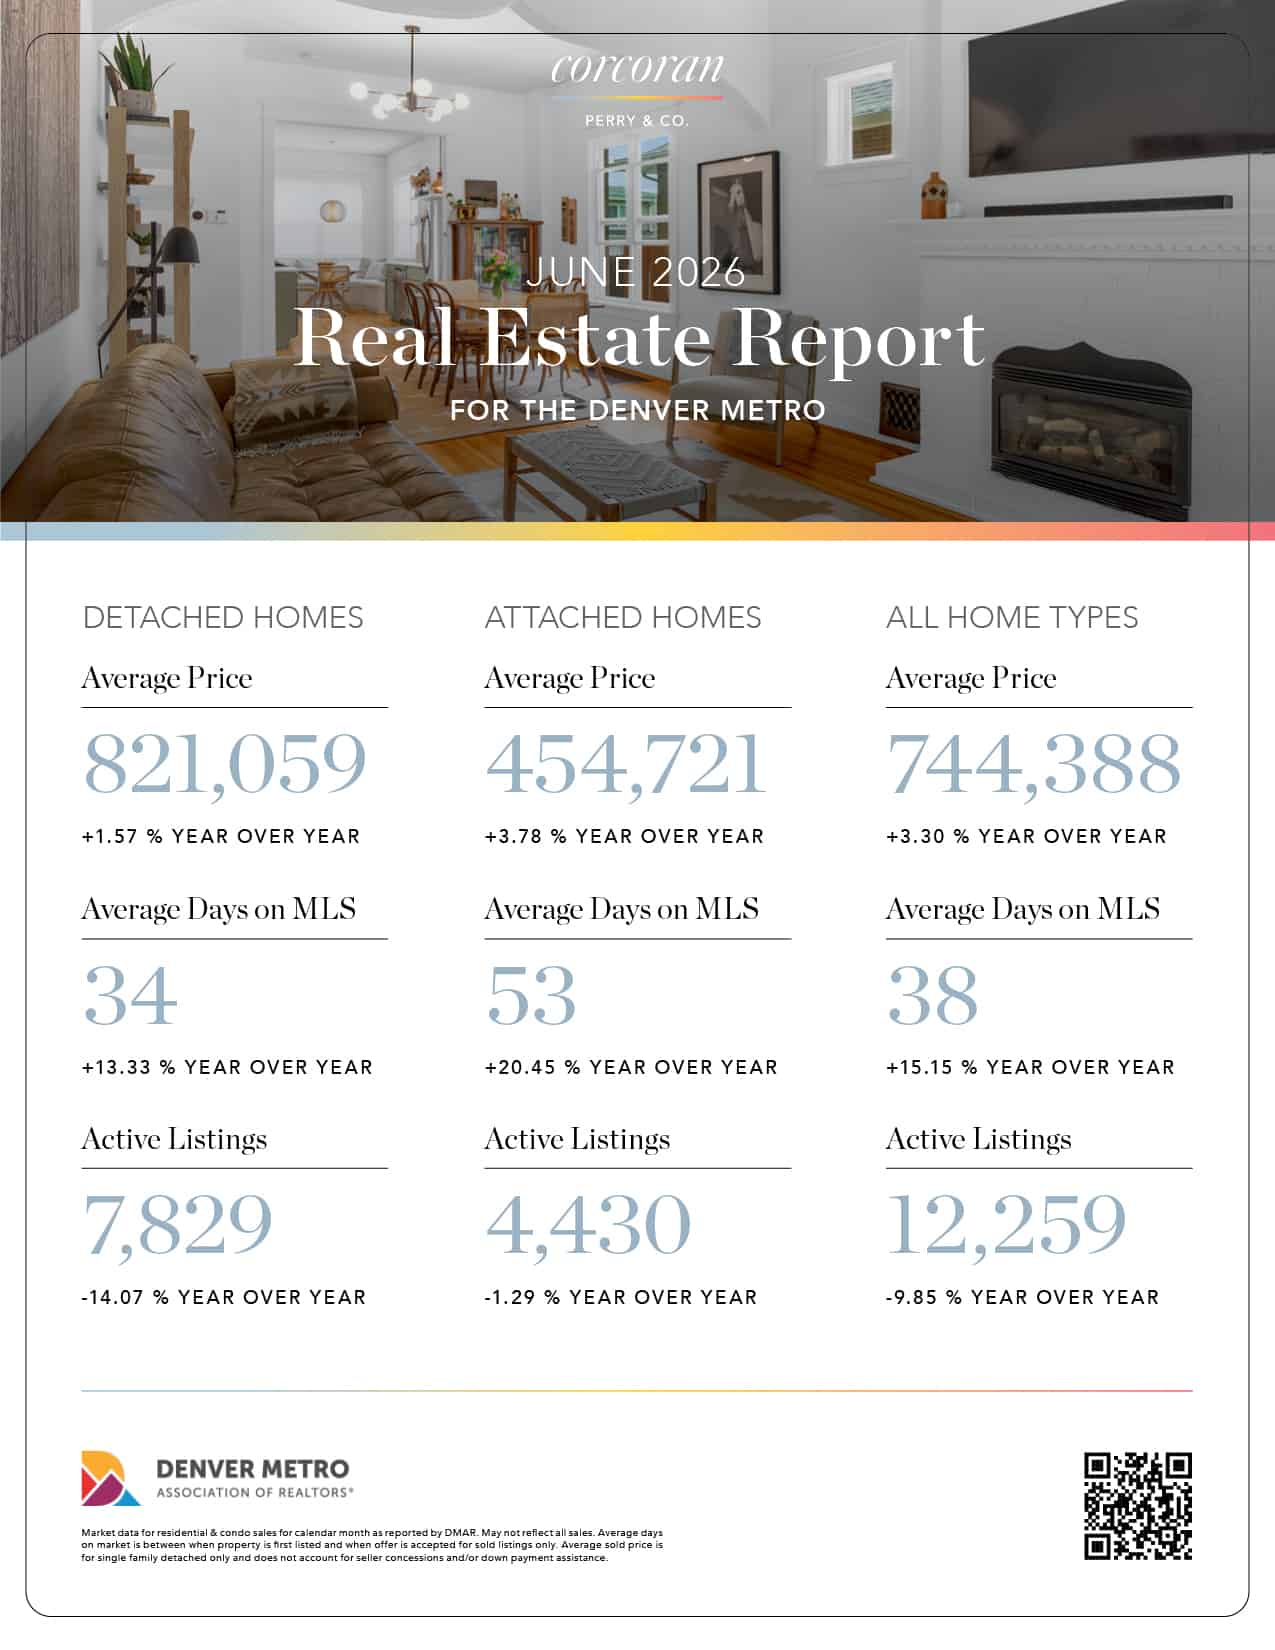
- Active Listings at Month's End: 12,259 (Up 6.24% MoM | Down 9.85% YoY)
- New Listings: 6,006 (Down 9.49% MoM | Down 17.47% YoY)
- Pending Sales: 4,134 (Up 1.17% MoM | Up 2.07% YoY)
- Closed Sales: 4,004 (Down 4.32% MoM | Down 6.97% YoY)
- Median Close Price: $615,000 (Up 2.24% MoM | Up 2.50% YoY)
- Average Close Price: $744,388 (Up 3.15% MoM | Up 3.30% YoY)
- Average Days in MLS: 38 days (Down 5.00% MoM | Up 15.15% YoY)
MoM (month-over-month): The most recent numbers compared to the stats from the month before
YoY (year-over-year): The most recent numbers compared to the same time frame a year ago.
Total Blockbuster (The Movie Store, Not the Hit)
Real estate has a strong seasonal rhythm that routinely forces MoM prices upward in the spring, independent of long-term volume trends. Usually, May is the peak of the spring buying season. Families rush to secure housing before the new school year, and properties listed in March and April finally hit the closing table.
Historically speaking, May should be a blockbuster month for listings and closings. Instead, Closed Sales dropped 4.32% MoM and 6.97% YoY. Further evidence of this seasonal (non)adjustment, average Days in MLS jumped 15.15% YoY.
The "Lock-In Effect”, Cemented
We’re all familiar with the “lock-in effect” (or “golden handcuffs,” if you’re feeling fancy).
Homeowners who bought or refinanced in the Covid era, when interest rates hovered around 3% for many months, have found it nearly impossible to shoulder a 4% or more increase in interest rates. When added to the high cost of homes and general inflation, it’s simply not an expense that fits into most people’s budgets.
Thus, the lack of housing inventory.
The golden handcuffs are no surprise; we’ve seen them in market report after market report. The difference is, this time there wasn’t even a hint of the usual spring boost to listing activity. Compared to the June 2025 market report, this year’s new listings decreased by more than 17%.
While last spring was subdued, new listings had still increased by almost 14% compared to 2024… the exact kind of little seasonal boost we expect to see this time of year.
This spring’s muffled real estate activity is likely due to increased economic concerns, stagnant interest rates, and global uncertainty.
Sticky Prices and Hidden Outliers
The June 2026 market report shows that sales volume is down (-3.90% YoY), with the Median Close Price still ticking up to $615,000 (+2.50% YoY).
Some of this can be explained by seller behavior. Homeowners tend to look at what their neighbors' homes sold for months ago and are highly resistant to lowering their initial asking prices. Instead of cutting prices to force a quick sale, many sellers will simply leave their homes on the market longer or pull the listing entirely. This causes transaction volume (closings) to drop before median prices show any meaningful downward movement.
This seller pricing pattern is likely playing a role in these metrics. But, in this case, the average home sale price is misleading. It’s skewed by the home type that boosts the average most: the expensive ones. High-interest rates or economic shifts disproportionately price out first-time and lower-income buyers, who rely heavily on financing. Meanwhile, affluent or cash-buyers are less sensitive to interest rate fluctuations.
If entry-level home sales stall out while luxury or high-end home sales keep moving, the median transaction price recorded for the month climbs. Fewer homes are selling overall, but the ones that do are heavily weighted toward the expensive end of the spectrum. The median price is rising partly because wealthier buyers are dominating the market while entry-level buyers are priced out.
Detached homes saw steady median price gains (+1.50% MoM and +1.50% YoY to $675,000). Attached homes saw their median price drop 2.47% YoY (down to $395,000), and their closed sales dropped a massive 17.84% YoY.
 Corcoran Perry & Co. Featured Listing: 5815 E 6th Avenue Parkway, Denver
Opportunities All Around
Though this landscape comes with obvious challenges, it also introduces strategic advantages for both sides of the transaction:
For Sellers: Scarcity is your greatest ally. Because the "Lock-In Effect" keeps new listings down by 17.47% YoY, you face remarkably low competition on the active market. If your property is turnkey and priced accurately, you can confidently rely on the stability of Denver's historical 6% appreciation path and a strong average sales price.
For Buyers: With average Days in MLS ticking up 15.15% YoY to 38 days, buyers can take their time, and sellers are motivated to close. Because casual sellers are staying put to guard their low interest rates, the homeowners listing their properties right now are frequently driven by major life events. This motivation brings crucial negotiation tools back to the table, giving you the room to aggressively pursue inspection contingencies, price reductions, and seller-funded rate buydowns.
Ready to make your next move? Our Denver real estate experts can be your guide.

Gina Cornelison


Socials