
June was a record-setting month for 2016!
We set yearly records for active listings, new listings, days on market, average sold price, median sold price, number sold, and sold volume. Since 2005, Denver has seen an average increase in listings of 4.2% from May to June. This year, however, listings increased 24.4% - a big jump compared to the past 11 years!
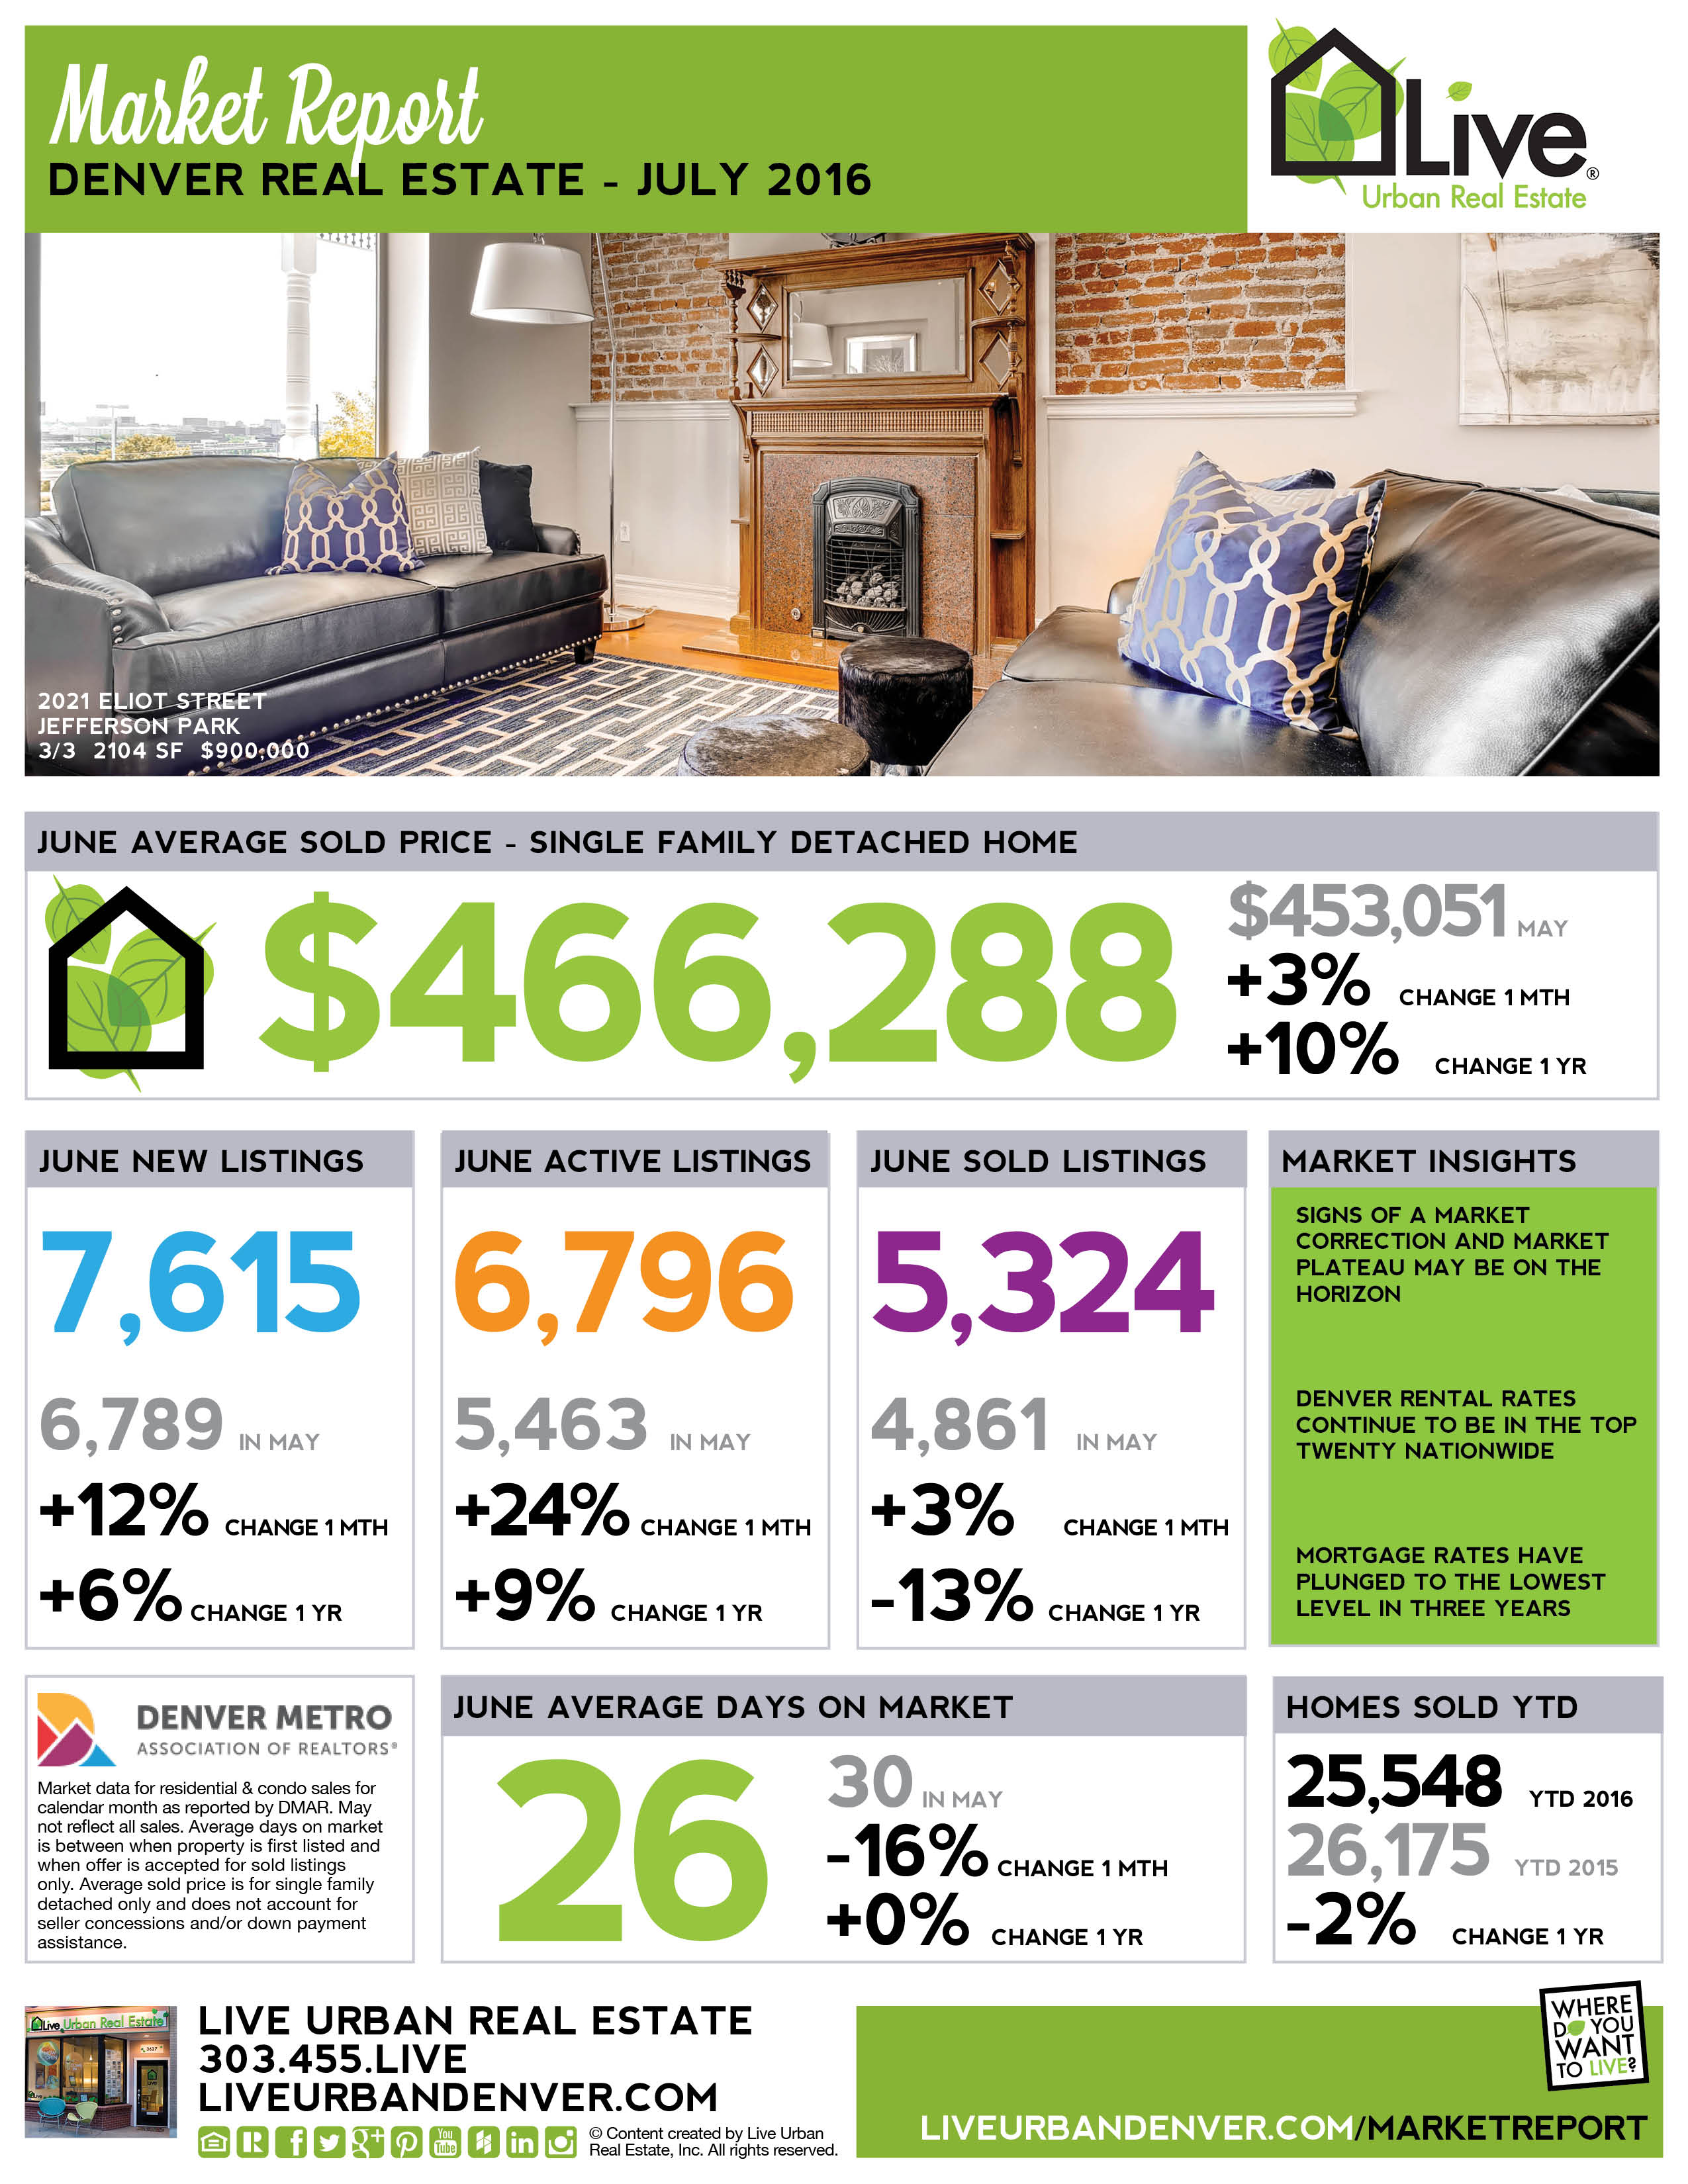
Since 1985, June represents the high water mark for active listings 19% of the time, compared to July and August, which represent the high water mark 26% of the time. We are starting to see signs of a much needed market correction and a market plateau may be on the horizon. Denver County is the #1 county in Colorado and #7 county in the nation for inbound migration.
Denver rental rates continue to be in the top twenty nationwide. Matrix searches are showing more price reductions as the number of active listings increased, giving buyers more choices. Some sellers in the suburbs are starting to consider contingent offers, or getting one to two offers compared to four to six that were common in the spring. More and more price adjustments are taking place in the Premier and Signature markets, as listings are priced high with room to negotiate. Once a first offer fails, the listings are coming back on the market at lower prices.
Buyers who were willing to put in backup offers are winning and going under contract due to deals continuing to fall out of contract. Mortgage rates have plunged to the lowest level in three years in recent weeks as the Federal Reserve reacts to Brexit (Source: Freddie Mac). Demand for U.S. real estate is likely to rise (Source: NAR). Top counties for sold homes in June: Denver (1,633); Douglas (1,354); Arapahoe (1,204); Jefferson (1,168).


Socials