

If you’ve been keeping an eye on local news, you’ve likely seen conflicting narratives: some claim the Denver property market is cooling (despite the summer heat, as they all point out), while others insist prices remain strong… and therefore, so does the market.
As is usually the case, the true story lies between the bold assertions and beneath the headline. The truth can be found in the Denver real estate numbers.
The August 2026 Denver Metro Association of Realtors (DMAR) report, based on July’s data, reveals a market driven by shadow concessions and seasonality-defying life events. Buyers are evaluating overall Denver housing costs, navigating interest rates floating near 6.5%, and exercising financial discipline. Sellers, meanwhile, are learning that success today requires flexibility, proper staging, pricing precision, and concession compromise.
Here is what you need to know about where the overall Denver real estate market stands, and where it’s heading.
Concessions Are the New Price Cuts
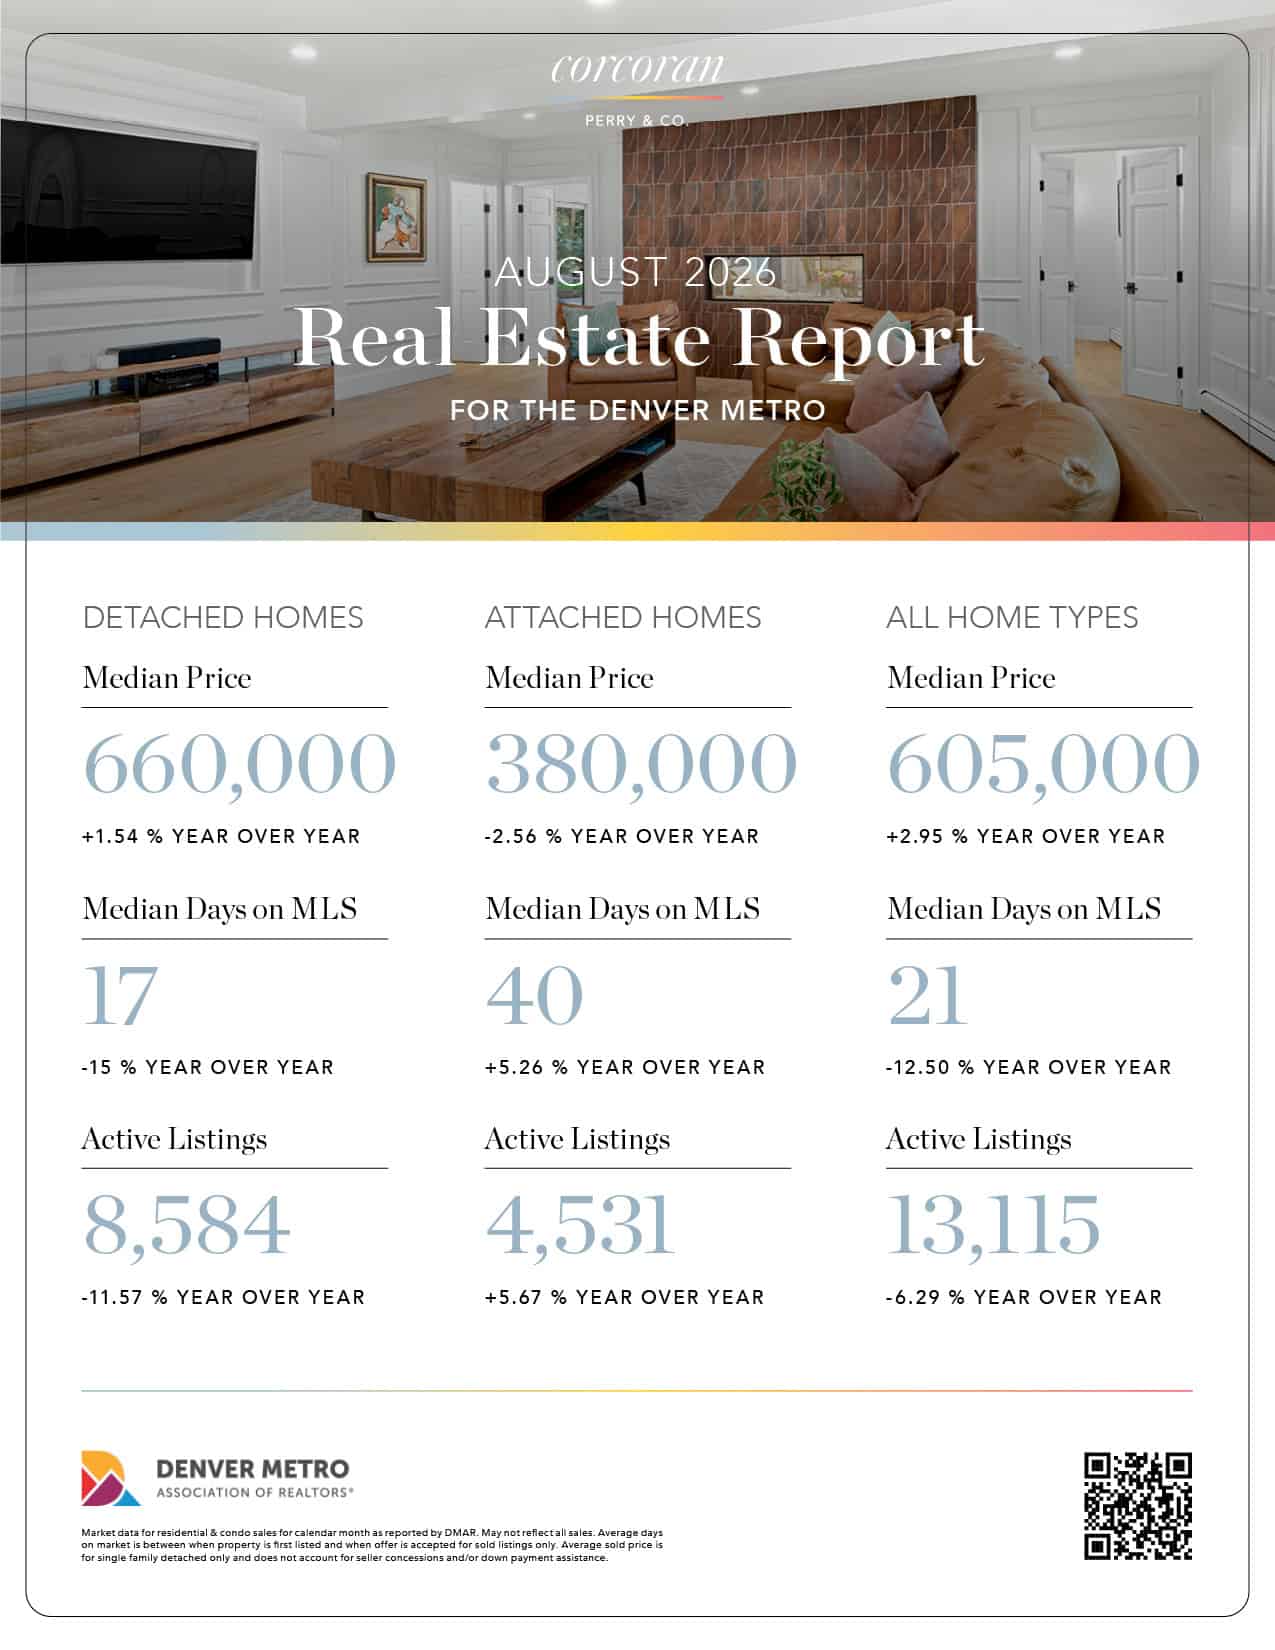
On paper, the overall Denver median home price dipped slightly in July to $605,000, a modest 1.54% drop from June, though still up nearly 3% year-over-year. The average price of a house in Denver reached $731,961, reflecting strong underlying resilience in long-term Denver home value. But looking solely at the sales price misses the real story of how deals are getting done.
Direct list price reductions aren’t the primary lever anymore. Instead, seller concessions have become the ultimate dealmaker. 62.9% of closed sales in the metro area now include seller concessions, with a median value of $10,000. It’s likely because rates floating around 6.5%+ mean buyers face high monthly payments. Using seller concessions for temporary (e.g., 2-1 buydowns) or permanent rate buydowns lowers the buyer’s monthly payment without requiring the buyer to drain their cash reserves.
Proactive sellers are holding their headline price while absorbing closing costs, covering inspection repair credits, or paying for permanent and 2-1 interest rate buydowns to help buyers clear the affordability bar. The public record looks stable, but net proceeds at the closing table tell a much more collaborative story.
Single-Family vs. Attached Homes
A single market average no longer tells the full story across Denver neighborhoods. Single-family detached homes and the Denver condo market continue to move in distinctly different directions:
- Single-Family Detached: Detached homes remain relatively stable with roughly 3 months of inventory. The median price of homes in Denver for single-family properties landed at $660,000, while the average house price Denver sellers are seeing reflects steady demand for detached inventory. Because land in established metro neighborhoods remains finite, well-priced standalone homes are continuing to move on a reasonable timeline (averaging 17 median days on market).
- Attached Condos & Townhomes: Attached properties are facing significantly more headwinds, dragging median prices down to $380,000 with inventory stretching near 6 months of supply. As recently highlighted by The Denver Gazette, elevated HOA insurance premiums (driven by regional hail risks, construction litigation, and climbing maintenance overhead) are eroding the traditional affordability advantage of buying a condo. Average time on market for attached inventory has stretched toward 40 to 60 days, giving buyers substantial leverage to negotiate terms.
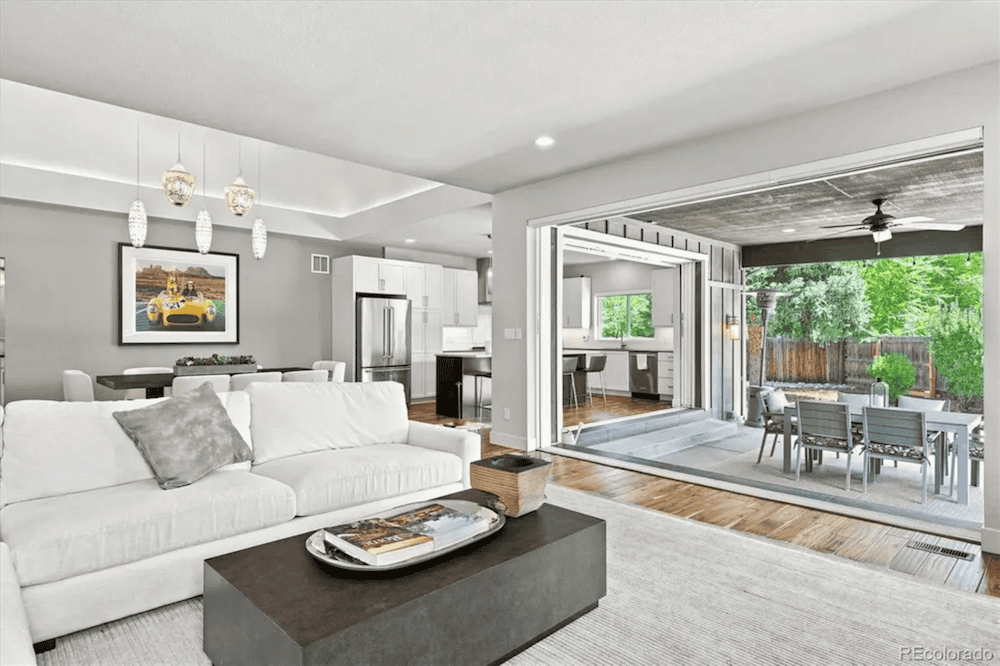 Featured listing: 2980 S Cherry Way, Denver
The Luxury Segment Operates on Its Own Rules
While the mid-market navigates interest rate calculations, the $1M+ luxury tier continues to perform with remarkable independence. High-end buyers (less sensitive to financing hurdles) are stepping up when premium inventory hits the market, driving luxury property turnover at a rapid median pace of just 17 days.
Notably, luxury condominiums are seeing a distinct surge. Closings for upper-end condos jumped 26% month-over-month and are up 81% year-over-year, buoyed by high-profile developments in lifestyle hubs like Cherry Creek. When prime properties align with location and prestige, the luxury buyer is ready to move.
What This Means for Your Next Move
- For Buyers: Using our interactive home search tools, you can explore active inventory hovering above 13,000 listings with time to make thoughtful decisions and negotiate meaningful rate buydowns or seller concessions.
- For Sellers: The market is still moving, but “aspirational pricing” will lead to lingering listings. Homes that are professionally staged, accurately priced, and paired with flexible concession strategies are continuing to achieve success.
Ready to make your next move? Our local Denver real estate experts at Corcoran Perry & Co. are here to guide you through every step of the process.

Gina Cornelison
Frequently Asked Questions
What are the current trends in Denver’s housing market?
The current Denver real estate trends point toward a concession-driven, life milestone-contingent market. Headline prices are steady, but over 62% of sales now include seller concessions (median: $10,000) for rate buydowns or closing costs. Single-family homes remain steady at roughly 3 months of supply, while attached properties sit near 6 months.
What is the median home price in Denver, Colorado?
The overall median home price in Denver, Colorado, sits at $605,000 across the 11-county metro area. Detached single-family homes carry a higher median price of $660,000, while attached condos and townhomes sit at a median price of $380,000.
What is the average house price in Denver, CO?
The average house price in Denver, Colorado, across all property types is currently $731,961, reflecting strong higher-end sales activity across the metro area.
Are there any new developments or projects in Denver’s real estate scene?
Yes. High-end luxury developments are driving impressive momentum, particularly in urban lifestyle hubs like Cherry Creek. Notable projects like the luxury condo residences at the Waldorf Astoria Cherry Creek have seen over 70% of planned units presold, with luxury condo sales up 81% year-over-year.




















Socials